Introduction
Epicflow’s Load Analysis feature is designed to equip project managers with insights into workload distribution across various tasks, projects, and resource groups. This guide aims to delve into the key functionalities, and how they can be utilized to optimize resource management and project execution.
Why Load Analysis Matters
Resource overload can lead to project delays and increased costs. Load Analysis enables managers to identify the source of these overloads, offering actionable insights for effective resolution.
Getting Started: Watch the Demo Video
To kickstart your journey, a demo video walks you through the tool’s key features.
For Further Reading: Check out this blog post for a comprehensive understanding of how Load Analysis integrates with Epicflow’s other features like Bottleneck Analysis to improve multi-project resource management.
How to Use
Resource Load Analysis
#Screen 1 Resource Load Analysis
- Accessing Load Analysis: Navigate to the Future Load graph via the Pipeline or Task List’s Group tab.
- Select a Resource Group: Pick a resource group of interest. Optionally, you can use the bottleneck analysis to identify the most overloaded groups.
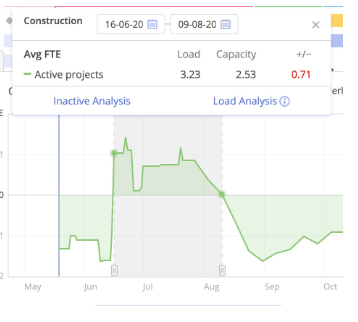
- Activate Load Analysis: Click on the resource group’s load graph to open the Load Analysis window.
- Define the Timeframe: Use the handle bars or date picker to select your timeframe of interest.
- Interpreting data: The pop-up window will display the average load, capacity, and difference—all in terms of Full-Time Equivalent (FTE). A value in red indicates overload.
Project Load Analysis
#Screen 2 Project Load Analysis
- Activate Load Analysis: Click on the resource group’s load graph to open the Load Analysis window.
- In the pop-up window, select the Load Analysis option to view which projects and tasks contribute to the workload during the selected period. Work hours will be displayed in the project bars.
Task Load Analysis
#Screen 3 Task Load Analysis
- View Contributing Tasks: By expanding the project bars, you can see which tasks are contributing to the load for the selected resource group during the specified timeframe.
- Understand Task Timing: Take note of the dashed area in which the tasks are displayed. This represents the possible time range within which the task should be executed to meet deadlines.
- Infinite Capacity Mode: In Epicflow’s infinite capacity mode, the task load is spread across this dashed time range. Therefore, in this mode, it’s possible that only the dashed area falls into your selected time period.
Refresh Load Analysis
- Refresh the analysis to instantly see the impact of any changes to the timeline or projects.
Exclude/Include Projects from Load Calculation
By default, all project groups and their associated projects are included in the Load Calculation. However, you can exclude either an entire project group or individual projects by clicking the minus (-) button next to the group or project name.
When a project group or project is excluded, the minus (-) button remains visible, indicating its exclusion. This exclusion setting will persist across all pages as you navigate the interface.
To include a project group or project again in the Load Calculation, simply click the minus (-) button once more. The button (-) will disappear, indicating the item is included.
#Screen 4.1 Exclude Projects from Load Calculation
Screen #4.2– Exclude a Project Group from a Future Load Graph
Switching Groups
#Screen 5 Switching Groups
- How to Switch: To analyze a different resource group, simply click on the dot next to the checkbox corresponding to the group you’re interested in. This dot is located in the ‘Group Selector’ section within the Future Load graph.
- Preserving Timeframe: Upon switching, the timeframe you have selected will be preserved, ensuring continuity in your analysis.
Understanding the Future Load Calculation Algorithm
Simplified Definition
The Future Load graph is based on a calculation algorithm that determines the available time range for each task within a milestone chain.
The system:
- Identifies the earliest and latest possible execution dates for a task.
- Takes into account predecessors, successors, and milestone constraints.
- Considers resource capacity.
- Distributes the task load evenly across the available execution range.
This approach allows Epicflow to highlight not only overload situations but also unfeasible task sequencing and milestone conflicts.
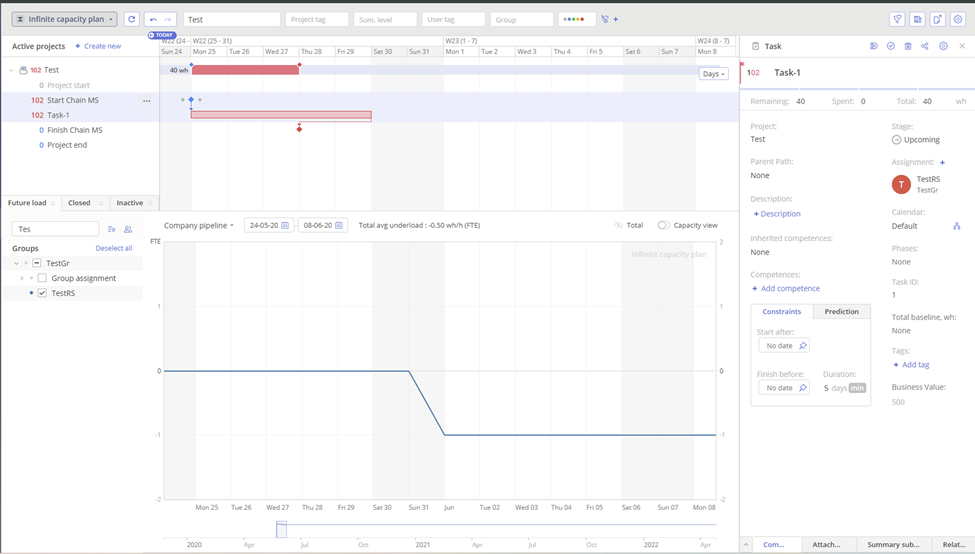
Example 1: Single Task (40h) Scheduled for One Week
A simplified chain contains a single task of 40 hours, scheduled within one week.
In this case:
- The Future Load is evenly distributed across all five working days.
- The FTE on the graph is shown as 0, which indicates the resource is fully allocated (40h out of 40h available).
Result: Fully utilized resource, no overload, no underload.
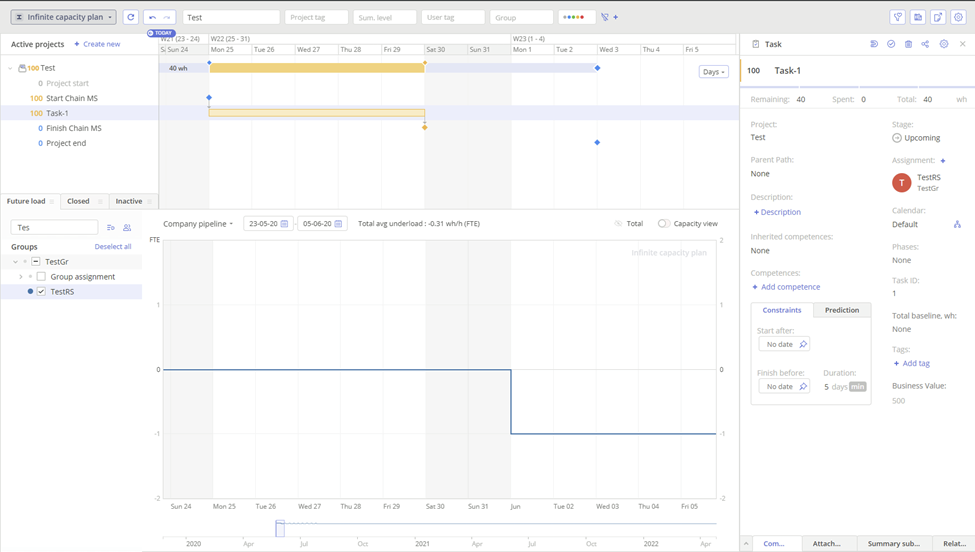
#Screen 6 – Example 1: Single Task (40h) Scheduled for One Week
Example 2: Single Task (40h) Over Two Weeks
Now the same 40-hour task is scheduled across two weeks.
In this case:
- The Future Load is evenly distributed across ten working days.
- The FTE on the graph is 0.5, which indicates the resource is underloaded.
- 40 hours are assigned within a period where 80 hours are available.
Result: Underutilization is clearly visible on the Future Load graph.
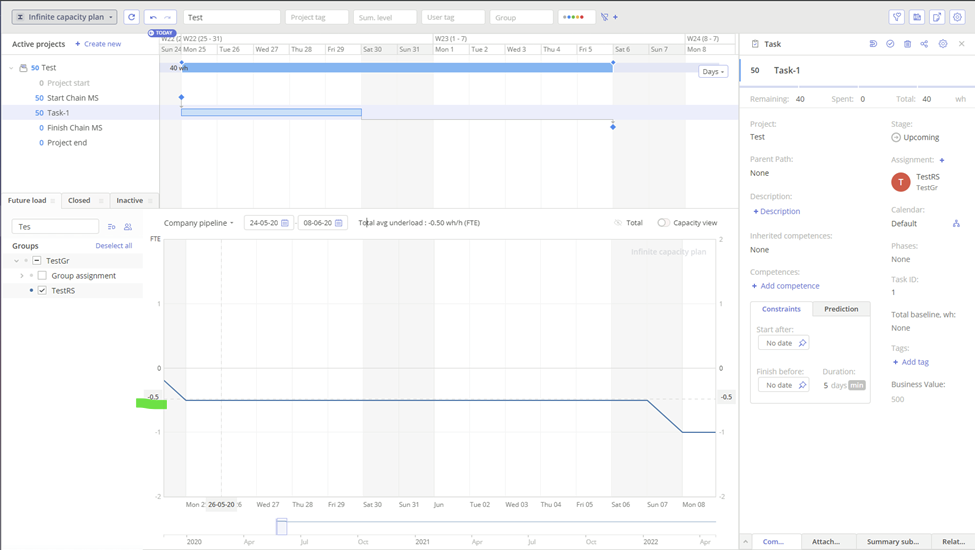
#Screen 7 – Example 2: Single Task (40h) Over Two Weeks
Example 3: Shifting the End Milestone to Wednesday
Now shift the End Milestone (End MS) of the chain to the closest Wednesday.
As a result:
- The task Priority indicates a 2-day delay.
- However, the Future Load is still shown across the entire week.
- Why? Because it is impossible to complete 40 hours of work in 3 working days when 5 workdays are required.
Result: The system maintains a realistic execution window despite milestone compression.
#Screen 8 – Example 3: Shifting the End Milestone to Wednesday
Example 4: Adding a Second Task
Let’s:
- Add a second task to the chain.
- Shift the End Milestone back to the end of the second week.
In this scenario:
- The Future Load is evenly distributed again.
- Week 1 load is fully determined by the First Task.
- Week 2 load is fully determined by the Second Task.
Result: Clean separation of task loads across weeks.
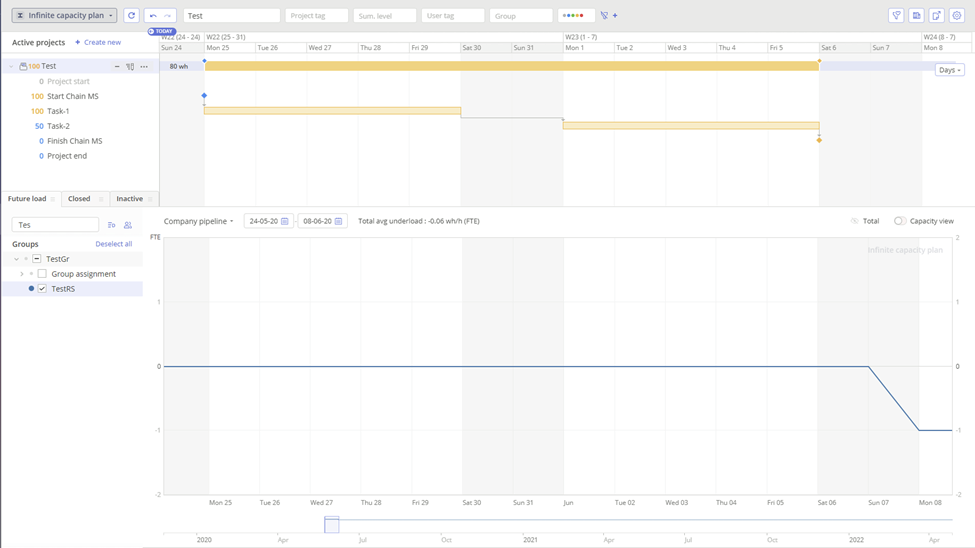
#Screen 9 – Example 4: Adding a Second Task
Example 5: Moving the Start Milestone to Wednesday
Now move the Start Milestone (Start MS) from Monday to Wednesday.
You will observe a small overlapping “mound” (hill) in the middle of the graph.
What this means:
- On that day, there are not enough available resources to complete all tasks within the defined time range.
- The resource would need to:
- Finish the First Task
- Start the Second Task
- On the same day
- This creates unfeasible planning.
Why This Happens (Algorithm Explanation)
Here’s how Epicflow calculates this:
- The system considers the End Milestone date.
- It allocates the last 5 working days to the Second Task.
- It then attempts to allocate the First Task within the remaining available period.
- Since the Start Milestone appears earlier than expected, the system must place Task 1 immediately after the Start Milestone.
- This leads to overlapping loads – shown as the “hill.”
Important Insight
This discrepancy appears because:
- The Gantt chart represents a sequential order of tasks.
- The Future Load Graph is calculated based on:
- Milestone chains
- Resource limitations
This approach helps identify:
- Unfeasible task sequences
- Unrealistic milestone constraints
- Incorrect estimates
- Resource conflicts
Not just multi-task overbooking.
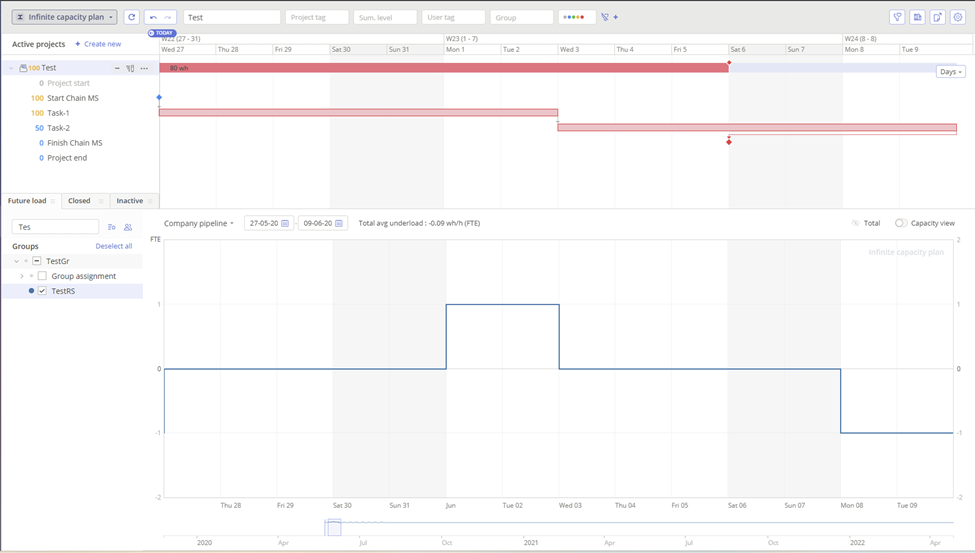
#Screen 10 – Example 5: Moving the Start Milestone to Wednesday
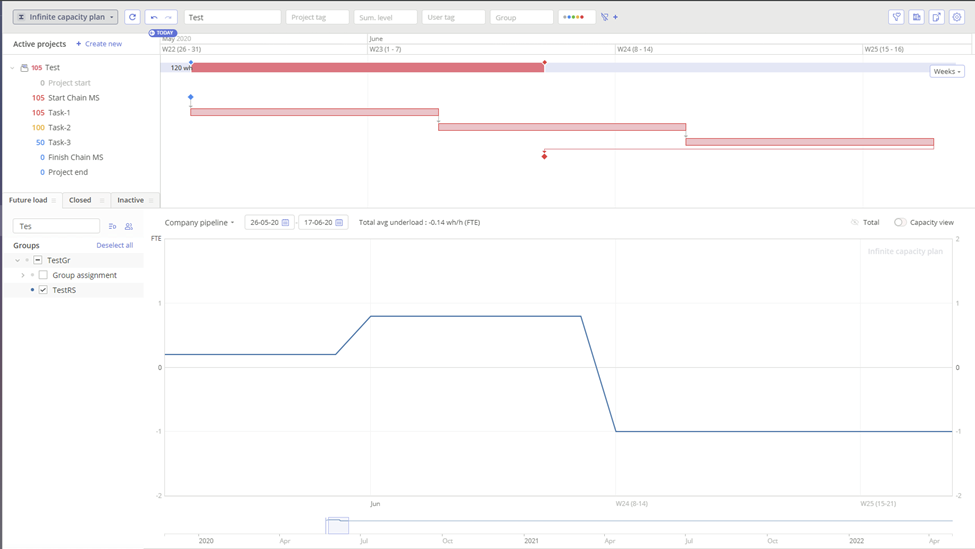
Example 6: Adding a Third Task
Let’s make the scenario more complex by adding a third task.
Now you will see two overlapping hills on the graph:
- First overlap: Between Task 1 and Task 2
(Wednesday through the following Tuesday) - Second overlap: Between Task 2 and Task 3
(Tuesday through the end of the second week)
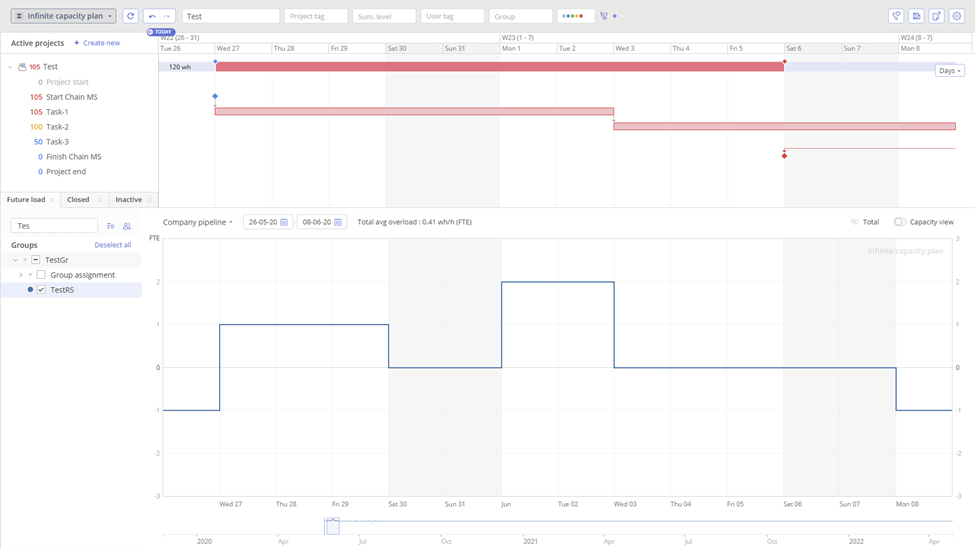
#Screen 11 – Example 6: Adding a Third Task
Important Observation
The load for the Third Task will not be depicted directly under its position in the Gantt chart.
It will be shifted according to the End Chain Milestone demand.
Also consider the situation where:
- The End Chain Milestone is not a separate item
- But defined as a Due Date inside the Task
In such a case, the Gantt chart will not explicitly display this constraint —
but the Future Load calculation will still account for it.
#Screen 12 – Example 6: Third Task Load Shift Caused by End Milestone
Viewing the Same Scenario with Prediction Functionality
The same unfeasible planning can be analyzed using Prediction functionality.
Prediction shows:
- How tasks and projects will actually be executed
- Under finite resource capacity
With Prediction enabled:
- The Future Load graph becomes flattened.
- Task positions in the timeline are adjusted instead.
- The system reflects realistic execution order based on actual resource limits.
This provides a practical view of how the project would unfold in reality.
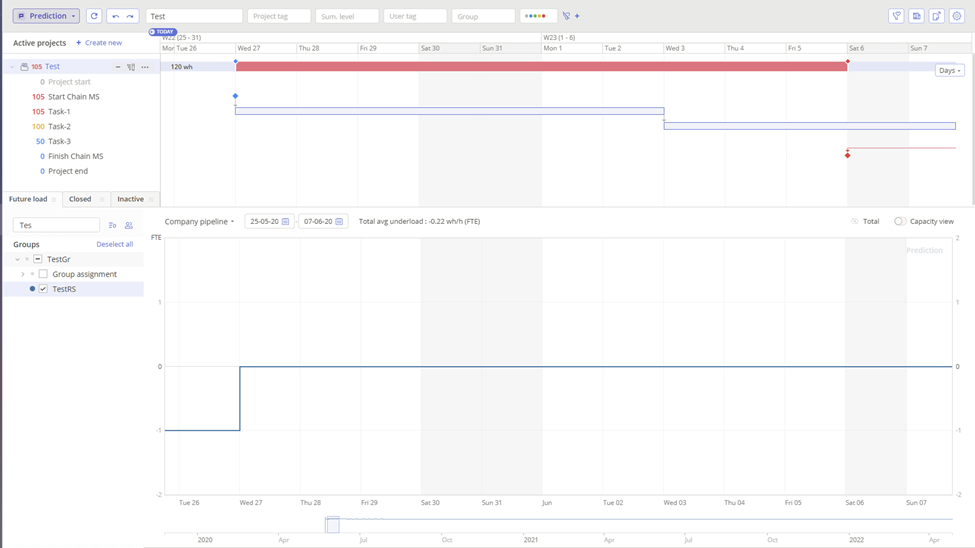
#Screen 13 – Prediction View
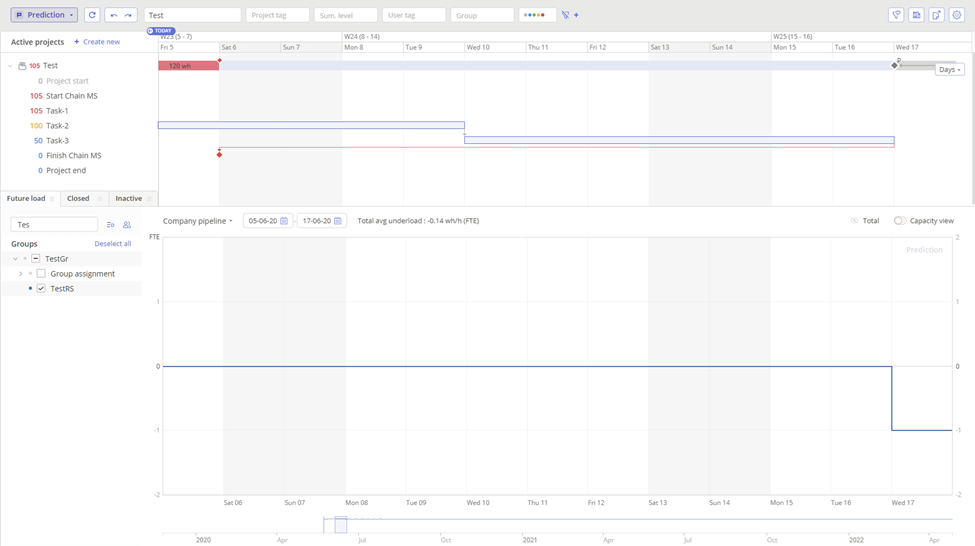
#Screen 14 – Prediction View
In Summary
It was developed as a proactive management tool that helps:
The Future Load graph is not just an instrument for observing resource overbooking.
- Identify potential resource overloads
- Detect unfeasible task sequences
- Highlight conflicts between tasks and milestone constraints
- Reveal inconsistencies between Gantt logic and resource reality
When combined with Prediction functionality, project managers can:
- Visualize realistic execution scenarios
- Optimize resource allocation
- Adjust schedules
- Refine task estimates
- Ensure overall project feasibility
Conclusion
Epicflow’s Load Analysis feature serves as an invaluable tool for project managers, offering actionable insights for real-time decision-making and resource optimization. This comprehensive guide provides you with the essential knowledge and step-by-step instructions to make the most out of this innovative feature.