Introduction
Epicflow’s Bottleneck Analysis is a structured method for uncovering constraints or bottlenecks that impede an organization’s performance. This feature empowers users to pinpoint the most burdened (or least utilized) resources within a defined timeframe. The objective is targeted and efficient resource management. This feature integrates smoothly with the Load Analysis tool, contributing to enhanced resource use and streamlined project workflows.
Why Bottleneck Analysis Matters
Bottlenecks can severely hamper project efficiency and lead to delays. Bottleneck Analysis helps managers identify these choke points in the resource flow, offering targeted solutions to improve project outcomes. This tool is essential for proactive management and effective resource optimization.
Getting Started: Watch the Demo Video
To kickstart your journey, a demo video walks you through the tool’s key features.
For Further Reading: Check out this blog post for a comprehensive understanding of how Load Analysis integrates with Epicflow’s other features like Bottleneck Analysis to improve multi-project resource management.
How to Use
Initiating Bottleneck Analysis
- Open the Future Load Graph, accessible from either the Pipeline, the Task List’s Group tab, or the resource management page.
- Locate the bottleneck analysis option at the top left corner of the future load graph.
- Choose the ordering criteria, like highest average or peak overload.
- Specify the date range.
- Resource groups will be rearranged based on your selections.
#Screen 1 Bottleneck Analysis
Bottleneck Sorting Guidelines
Options for ordering resource groups include:
- Default Order: As they appear on the resource management page.
- Alphabetical: Alphabetical arrangement.
- Average Overload: Based on average overload for the chosen date range.
- Average Underload: Average underload within the selected date range.
- Peak Load: Maximum load within the chosen date range.
Date Range Options
- This week: From today to day 7
- This month: From today to day 30
- This quarter: From today to day 120
- Next week: From day 8 to day 15 starting today
- Next quarter: From day 31 to day 60 starting today
- Graph range: The interval selected on the graph. Refresh is required if this range is changed.
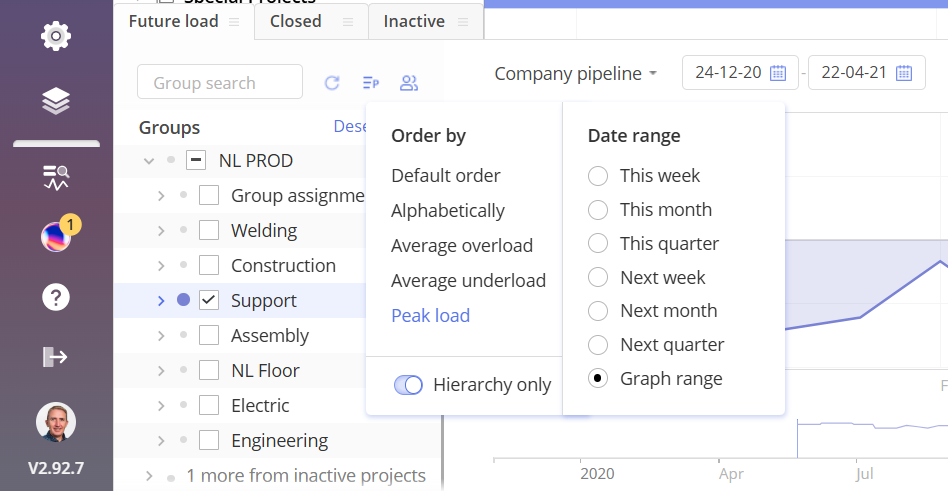
#Screen 2 Date Range Options
Bottlenecks hidden in Hierarchy
When displaying groups in hierarchy mode using multi-groups, the ranking depends on the workload of the top-tier group. Generally, bottlenecks are less apparent at upper levels. To isolate bottlenecks at the resource group level, you can deactivate the Hierarchy mode, an option found at the base of the bottleneck ordering menu. This will produce a simplified list of groups, with the primary bottleneck displayed at the top.
#Screen 3 Hierarchical Bottlenecks
User-Level Bottlenecks
The analysis is also applicable at the individual user level. Click on the group/user selector at the top of the future load graph menu for this. This will yield a simple list of users, generics, and unit pools, organized according to your bottleneck criteria.
#Screen 4 User-Level Bottlenecks
Synergizing Bottleneck and Load Analysis
One effective strategy is to synchronize bottleneck and load analysis. For example, identify the most overloaded resource or group using bottleneck analysis, and then utilize load analysis to determine which tasks or projects are responsible. This approach can also be adapted for a list of users. Since resources are ranked, it’s easier to redistribute work more equitably, enhancing your resource pool’s efficiency.
Benefits
- Boosts project efficiency through the identification and removal of bottlenecks.
- Enhances resource distribution, mitigating project setbacks.
- Enables proactive management to avert crises.
Conclusion
Both the Load Analysis and Bottleneck Analysis tools are indispensable for organizations aiming to refine their resource management tactics. These features provide a data-driven avenue for optimizing resource and project administration, resulting in marked gains in efficiency and productivity.