The top critical information about projects’ budget you can monitor via 2 graphs – Dashboard and Burnup.
The main strategy here is to have a periodic overview from Project Manager side to control budget and flow of the project. You need to control the situation and do not allow running out of the estimated Budgeted area and furthermore fit into Approved expenses.
Burnup
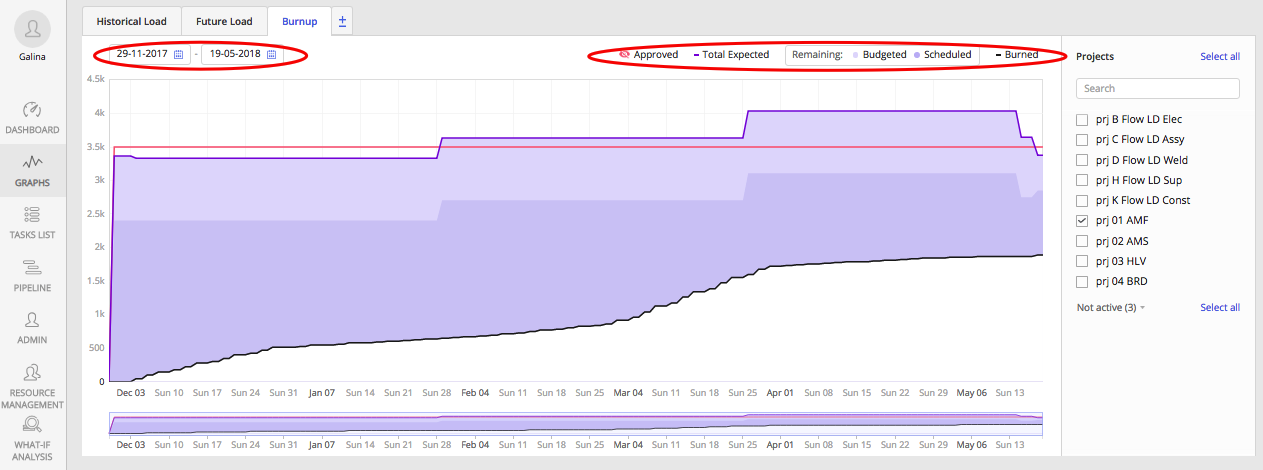
Screen #1– Burnup (main)
Login and navigate to Graphs, Click on + Graphs, click on a checkbox Burnup, move to the Burnup Tab.
Attention: Burnup is visible without special permissions, but you need permission in order to see financial information.
Using Calendar in the left upper corner you can pick a specific date in order to see data for it.
You can choose the Project from the list in the right corner OR Select all to check overall status
Cost Estimation is measured in man-hours.
Manage the main indexes regarding projects Budget:
– APPROVED
– TOTAL EXPECTED
– BURNED
APPROVED line, a red one, indicates the planned project’s cost.
TOTAL EXPECTED, a purple one, is an indication of the estimated project cost and it consists of two areas:
– Budgeted
and
– Scheduled
First one is a set of our reserves and the second one is an indication of the part which is already assigned for some work accomplished.
The last area is BURNED. Meaning of it is the costs which already are spent on project accomplishment.
Financial view
In advance settings, you have an opportunity to view the finance status. You should have permission to monitor this information.
Dashboard
Screen #2– Dashboard (main)
Navigate to the Dashboard and select Budget view.
You should have permission to monitor this information.
Budget view is a visualization mode for the dashboard which contains Budget Utilization % (men hours) of the Projects in accordance to Lead time %. Here you can monitor dependency between Project Priority and Budget buffer.
Dot-dash circle represents the Budget Utilization:
- Over the bubble – buffer available
- Around the bubble – no buffer is available
- Less than the bubble – you spent more than Approved
Using Calendar in the left upper corner you can pick a specific date in order to see data for it.
You can choose the Project from the list in the right corner OR Select all to check overall status.
Hover over a bubble and you will see the amount of remaining work in hours and the type of the tasks.
Also, it is possible to click either on the bubble or on the dot left to the project’s checkbox in order to freeze bubble.
You can play the history of bubbles (projects) delivering while one bubble is frozen, so its data will be permanently visible.