Manage the Milestones is one of the instruments of Project Management which allows you to work with structure of the Project itself concentrating your attention on unfeasible Critical Path chains.
Meaning of different milestones colors
All milestones, as well as range between those, are colored in four types of color: red, yellow, green, and blue. Color of the milestone is determined by the most constraint Top Critical Path to the milestone.
- Red signals that milestone is unfeasible and you wont be able to achieve in time
- Yellow warns about buffer reducing (no buffer available)
- Green and blue show you’re on the right track (20% of buffer)

Screen #1– Pipeline – Milestones
Milestones Grouping and Filtering
To groups milestones by the nearest dates, you should use a blue slider located closer to the inactive project area in the right corner.

Screen #2– Pipeline – Grouping Milestones
The colored slider helps to provide you a better centralized view of your milestones if you have too many of them in the pipeline.
- If you select blue, it shows you all the milestones in the project.
- If you select green, it shows you every milestone except the blue ones.
- If you scroll to yellow, only red and yellow milestones will become visible.
- If you scroll to red, only red milestones will be filtered.

Screen #3– Pipeline – Filtering Milestones
When the slider is in a red position, you can see the most critical milestones – the most problematic places in the project that require immediate attention.
Both sliders will help you reduce information load if you deal will lot of milestones.
Dealing with unfeasible milestones
Once you agreed on the budget, uploaded the project with estimations and assigned resources, Epicflow would calculate feasibility according to team capacity and might indicate some milestone as red. It means that planning is not feasible and the project will face a delay. But, you can start work on some milestones earlier (drag milestone until it becomes yellow) and save your external due date as it was agreed in the contract. OR you can hire\assigned additional resources to accomplish the planning.
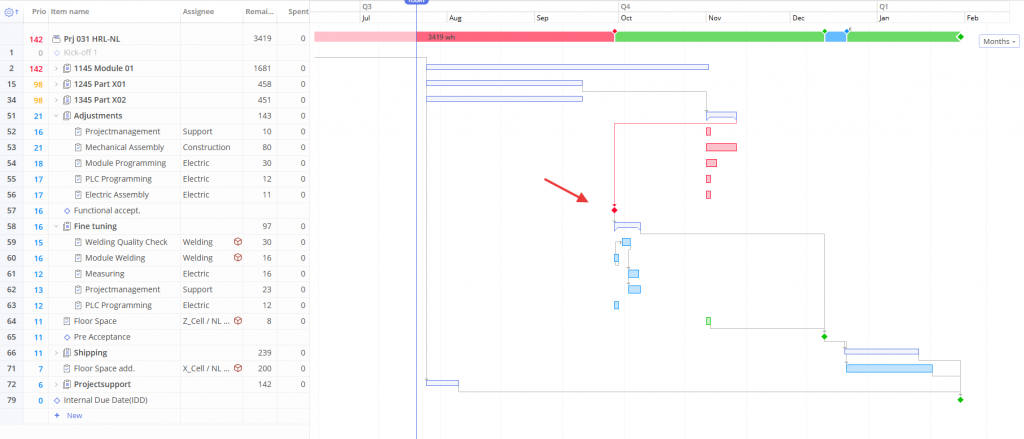
We show feasibility between milestones, meaning that tasks in between don’t affect the overall feasibility. When there are issues requiring immediate attention, milestones are highlighted in red. However, tasks that come after a red milestone may still be marked in a different color. This indicates that, even if a date has passed, the next milestone can still be achieved. This approach helps you focus on critical areas, avoiding unnecessary alerts.
In the example below, you can see a red milestone where the next milestone is green.

Screen #4.1– Gantt Chart- Feasibility between Milestones
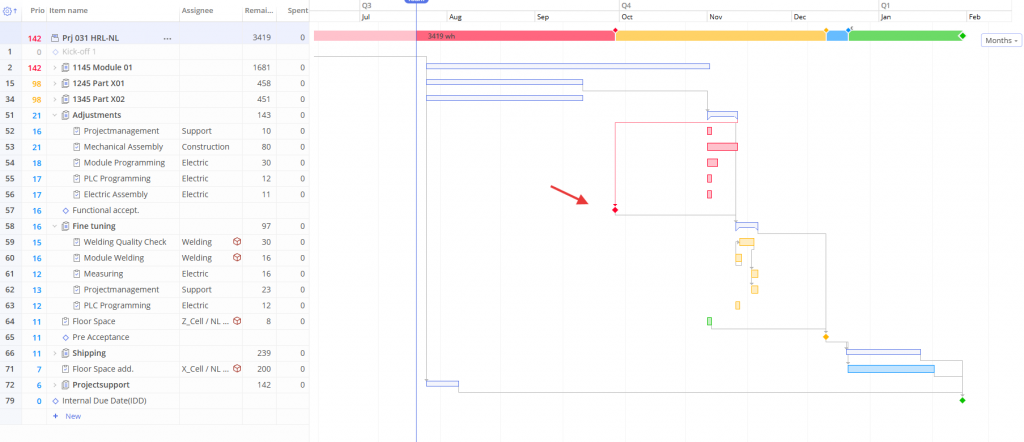
In the example below, you can see how we can influence feasibility between milestones by adding relations between them. The only difference between the above and this example is that now the ‘Fine Tuning’ item has ‘Adjustments’ item defined as a predecessor, which results in the yellow color of the next milestone.

Screen #4.2– Gantt Chart- Feasibility between Milestones
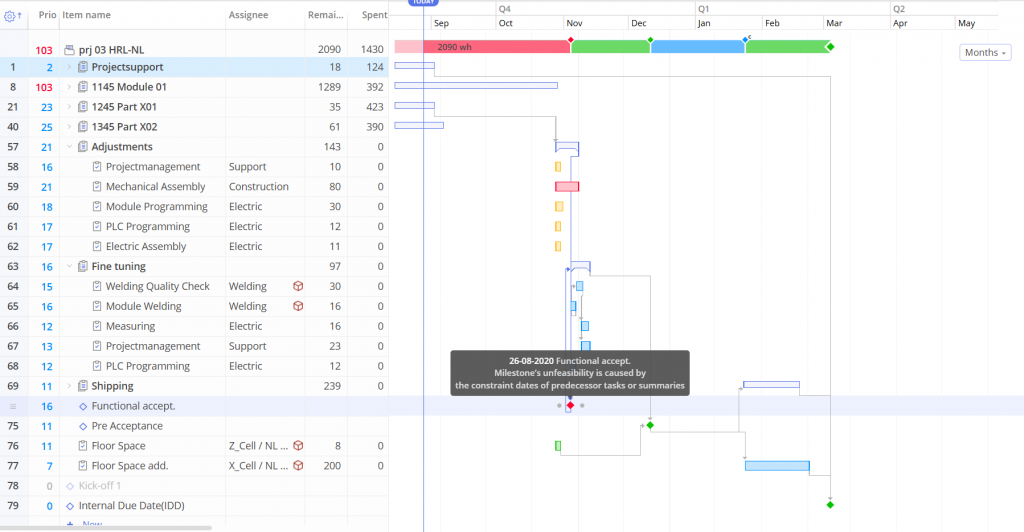
To make the investigation process easier and more efficient, when a milestone is marked in red due to being affected by the constraint dates, this information will be displayed when you hover over the milestone.

Screen #4.3– Gantt Chart- Feasibility between Milestones
Moving single or multiple milestones
Moving Milestone is an instrument of Project structure change which can be used for re-planing of unfeasible Top Critical Chains
- To change the positioning of a milestone press left mouse button on such and drag it to the desired position.

Screen #5– Pipeline – Moving Milestone
Result of such dragging will be recalculation of the Top Critical Paths connected to the selected milestone
- For multiple milestone selections, hover over your mouse cursor over the start milestone, to the right of which you would like to select all milestones, and from appeared menu select option “Select MS’s to the right”. Transfer all selected milestones to new position with drag and drop functionality.

Screen #6– Pipeline – Multiple Milestones Moving

Screen #7– Pipeline – Result of Multiple Milestones Moving
