Introduction
The key focus of advanced Project Management is Critical Path. In simplified definition it can be defined as the longest sequence of tasks in a project that must be completed on time for the entire project to finish by its deadline.
Key aspects of usage:
- Define the minimum project duration
The Critical Path identifies the longest chain of dependent tasks, which determines the earliest possible completion date for the entire project. - Analyse feasibility of the tasks that might cause a delay for the whole project
Because every task on the Critical Path directly influences the final deadline, assessing risks, constraints, and potential bottlenecks within this chain is essential to avoid schedule overruns. - Analyse Priority of tasks in the chain to prioritise resources distribution and optimise schedule
The Priority is a dynamic metric calculated as of the current date, reflecting the urgency of tasks within a project. Rather than focusing solely on the task’s deadline, it accounts for the pressure imposed by the entire chain of dependent tasks leading to future milestones. A task might seem manageable when viewed in isolation, but its Priority can increase if subsequent milestones in the chain are under significant time pressure.
Example
1. Task Example: Electrical Assembly (Priority 90 – Yellow)
Despite having a green Gantt bar, the task Electrical Assembly has a priority of 90 (yellow). This occurs because the critical path to the second milestone imposes more pressure than the first milestone. Although the critical path to the first milestone appears feasible, the second milestone’s tighter constraints increase the task’s priority. In such cases, you might consider moving the first milestone earlier to reduce pressure on subsequent tasks.
2. Task Example: Module Welding (Priority 68 – Green)
In contrast, Module Welding has a priority of 68 (green) but a yellow Gantt bar. The Gantt bar is yellow because the task is part of a critical path between the first and second milestones, with less than 20% float or buffer. The priority of 68 is lower than 80 because it’s calculated based on the remaining work within its critical path, assuming the task could start immediately with all its predecessors completed.
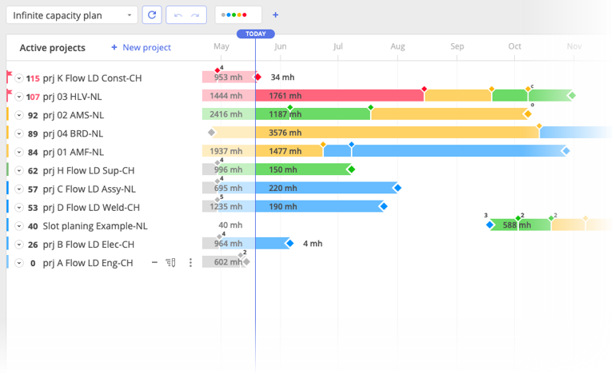
#Screen 1 – Visualisation of Gantt chart bar colour based on task priority
Critical Path Highlight in Task Cards
When hovering over the priority in a task card (for individual tasks, not summary tasks), Epicflow provides a visual representation of the critical path. This feature allows users to view the sequence of dependent tasks that influence the task’s priority and overall project timeline.
#Screen 2 – Visual representation of the critical path
The critical path displayed may lead to either the next milestone or the next constraint date set on the task, depending on which occurs first and has a greater impact on scheduling. By analyzing this path, users can identify dependencies and potential bottlenecks, helping to prioritize efforts effectively.
This functionality provides valuable insights, ensuring timely task execution and helping teams stay aligned with project objectives.
General Rules for Task Priority and Gantt Bar Interpretation
1. A task’s priority is calculated based on workload in the critical path, time pressure, and both milestones and task constraint dates. The Gantt bar appearance reflects the feasibility of the task’s critical path between milestones only, considering intermediate milestones within the task chain.
2. A task can have a high priority even if its nearest milestone appears feasible. This occurs when future milestones impose higher time pressure, making the task more urgent.
3. Tasks on the critical path will show reduced scheduling flexibility if there is limited time available between milestones. A task’s Gantt bar appearance may be affected even if its priority is moderate, due to constraints elsewhere in the task chain.
4. If a task’s nearest milestone seems achievable but its priority is still high due to time pressure from future milestones or constraint dates, consider adjusting earlier milestones or redistributing workloads.
5. Task priority is calculated as if the task could start today, assuming all predecessors are complete or that preceding constraint dates do not exist. This approach forecasts potential delays across the task chain.
6. Priority help identify tasks requiring immediate attention, while Gantt bar appearances evaluate task feasibility based on milestone-driven constraints.
Possible date range – Advanced
Possible Date Range refers to the earliest and latest dates within which a task or project can realistically be scheduled, considering all relevant constraints. These constraints may include task dependencies, resource availability, milestone deadlines, and task-specific constraint dates.
In project management, the possible date range indicates the time window during which a task can be started and completed without violating critical scheduling rules. It serves as a guide for determining whether tasks can be delayed, accelerated, or re-sequenced while maintaining overall project feasibility.
Key factors influencing the possible date range include:
• Earliest Start Date: The soonest a task can begin, determined by task dependencies.
• Latest Finish Date: The latest a task can be completed without delaying dependent tasks or violating constraints.
Understanding Priority Differences Across Multiple Phases and Critical Paths
In complex projects, it is common to have several phases, each containing multiple milestones (for example, Phase 1 Milestone A, Phase 1 Milestone B, Phase 2 Milestone A, Phase 2 Milestone B).
Even though these phases follow a logical chronological order, tasks belonging to later phases may still receive higher priority when their critical paths contain significantly more work.
Different Phases Can Have Different Critical Paths
For example, when analysing the critical path between milestones within a phase, Epicflow may display the following workloads:
- Critical paths for Phase 1:
- Longest path: 368 hours
- Critical paths for Phase 2:
- Longest path: 520 hours
- Additional paths: 440 hours, 440 hours and 360 hours
Even though Phase 2 occurs later, its longest critical path (520h) requires substantially more work than the critical path of Phase 1 (368h). Because the available time does not increase proportionally to the workload, Epicflow assigns a higher priority to tasks contributing to Phase 2.
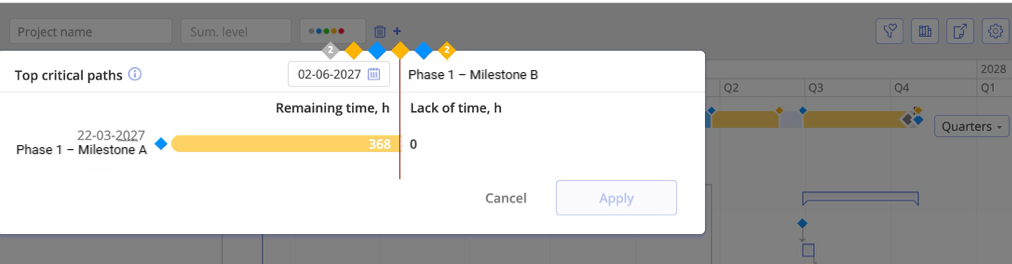
#Screen 3 – Critical Paths analysis example
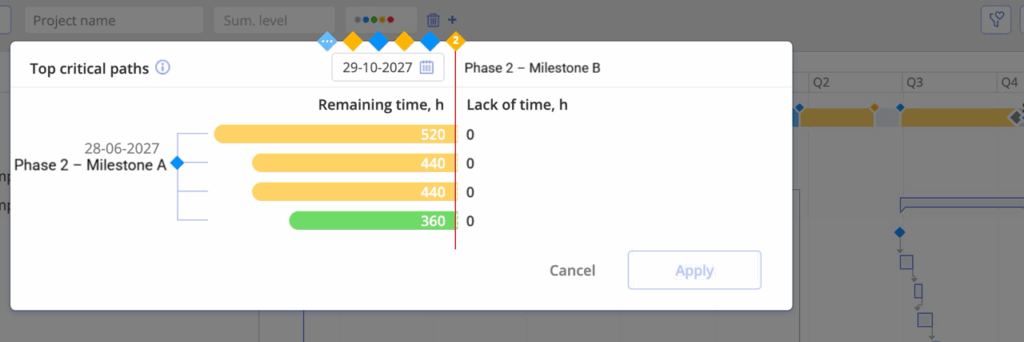
#Screen 4 – Critical Paths analysis example
Why a Later Phase Can Become More Critical
Priority is determined by:
total required work in the critical path vs. time available,
not simply the chronological order of milestones.
If a later milestone requires much more work but only slightly more time, it becomes more urgent, even though it appears further to the right on the timeline.
Analogy
Two trips:
- Trip A: 368 km
- Trip B: 520 km
Trip B starts later, but because it is much longer, you must begin earlier to stay on schedule.
Epicflow applies the same logic with workload instead of distance.
Managing Possible Date Ranges and Task Prioritization
In some project scenarios, the Possible Date Range requires special attention due to how parallel tasks are prioritized. Consider the example below where three tasks run in parallel under the first project summary:
• Electrical Assembly (prio 104), the most critical task requiring urgent attention.
• PLC Programming (prio 101), reflecting pressing importance.
• Module Programming (prio 96), showing only a small possible date range, even though one might expect its timeline to extend to match Electrical Assembly (prio 104).
One might argue that the task Module Programming (prio 96) should have its possible date range extended to match the length of Electrical Assembly (prio 104), suggesting that PLC Programming (prio 101) should not be critical if a slight delay wouldn’t impact the final delivery date.
However, as a consequence of Epicflow’s Priority Calculation, which considers only successor tasks and not parallel ones, PLC Programming (prio 101) remains critical if its successors are at risk, even after completing Electrical Assembly (prio 104).
This approach differs from Goldratt’s Critical Chain Method, where feeding buffers are calculated for each parallel task. This results in lower priorities for parallel chains until a delay becomes significant enough to impact the overall schedule. While this can create an optimistic view, showing progress on the critical path while masking potential risks in parallel tasks, it often results in last-minute crises when delays accumulate unexpectedly. This phenomenon is explained in this article: “Once in Red, Always in Red”.
How Epicflow Manages Task Load Distribution and Risk Awareness
The Epicflow approach ensures that project managers stay aware of potential risks before they escalate. This is reflected not only in the priorities or the colors of the Gantt bars but also in the Future Task Load view. As long as the task chain remains feasible, the load is distributed across the Possible Date Range. However, if the chain becomes unfeasible, the load from the remaining work that cannot be distributed is shifted to the start constraint of the chain.
Example
Consider two consecutive tasks, each requiring 40 hours:
• The first task is handled by an engineer.
• The second task is executed by a production employee.
Both tasks must be completed within two weeks, meaning the daily task load at the start is 8 hours per day for two weeks, with a priority of 100.
If after one day, the engineering task hasn’t started, the priority increases to 101. The question now is how to handle the 8 hours that no longer fit within the possible date range.
Distributing these hours across the entire task chain might seem reasonable at first, but over time this accumulates at the last task in the chain, causing a bottleneck toward the end. This mirrors a common issue in many organizations where tasks appear manageable at the beginning, but delays cause last-minute rushes and cost overruns.
To prevent this, Epicflow assigns the extra 8 hours to the start constraint of the chain. This approach signals immediate action rather than pushing the delay downstream, helping teams address issues early and avoid unnecessary costs.
By proactively reflecting these risks in both the Gantt and Future Task Load views, Epicflow supports better decision-making and keeps projects on track.