In Epicflow, Prediction is a way to plan the order of task execution, considering their priority and business value. It introduces a more flexible, intuitive, and powerful way to simulate project execution and resource allocation across portfolios.
As a Portfolio/Pipeline Manager, you can create a Prediction Plan
based on either priority or business value. The system then calculates task
dates and generates a Gantt chart accordingly. It includes configuration
management, advanced simulation logic, and fine-grained control over
prediction behavior.
To set up or change prediction plan, a user must have corresponding permission. More about this you can read in this article.
If you have a ‘manage prediction’ permission you can run or rerun it in the Pipeline, Quick Edit Mode, Future Load Graph or Group Task List View.
Planning Type – Prediction (Basic)
Prediction takes into account all projects and their interdependencies to create a sequence of task execution. This planning type considers the overall priorities and business value across all projects. This means that the system optimizes scheduling for the entire portfolio of projects, calculating task dates and generating a Gantt chart based on these priorities. It operates under a finite resource capacity, meaning the system ensures that resources are allocated within the available limits.
There two types of Prediction:
- All Active Pipeline projects
- Single Project
In summary, Prediction handles the bigger picture, considering all projects, while Single Project Prediction is designed for more granular control of a specific project.
To run Prediction for All Active Pipeline projects,
- Navigate to the Pipeline page and select option “Recalculate All”, located to the right from the sub-item “Prediction” – an element of “Planning type”
Screen #1 – Prediction Setting
On the other hand you also can perform Prediction for a Single Project. It works the same way as Prediction but is applied to individual, selected project and can only be executed within the Quick Edit Mode (QEM). This approach focuses on scheduling and adjusting tasks for a specific project, optimizing within its unique constraints. Unlike prediction, which applies to the entire pipeline, Single Project Prediction is focused and tailored to the needs of a single project, balancing resources and task execution specifically for that project.
To run Prediction for a Single project
- Go to the Quick Edit mode of the project
- Choose the ‘Run Prediction’ option in the Plan Type selector drop-down.
As result you’ll be redirected to the Pipeline Prediction Frame. It’s the main entry point, supporting flexible configuration.
Screen #2 – Prediction Setting
You can read about other types of planning in this article.
Key features
Pipeline Prediction Frame consists of next elements:
- Scope for prediction
- All active projects
- Filtered only – applies predictions only to projects defined by the applied filter
- Configuration – allows to save, copy, rename, and delete prediction configurations
- Parameter impact on the task order – slider with seven fixed levels to define impact from “Task Priority” down to “Task Business value”
- Completely Priority Oriented (100 vs 0 impact mix)
- Significant impact of Priority (80 vs 20 impact mix)
- Impact of Priority (60 vs 40 impact mix)
- Balanced (50 vs 50 impact mix)
- Impact of Business Value (40 vs 60 impact mix)
- Significant Impact of Business Value (20 vs 80 impact mix)
- Completely Business Value Oriented (0 vs 100 impact mix)
- Other Parameters of Prediction run
- “Allow temporary multitasking” – Temporarily switch to shorter tasks when doing so doesn’t make the original large task unfeasible
- “Continue prediction after failure” – If a task can’t be predicted, prediction will continue for its successors. The failed task will be skipped with a minimal duration.
- “Intermediate milestones block next tasks” – Next tasks can’t start earlier than preceding intermediate milestones. Starting milestones will not be neglected.
- Advanced Prediction configuration – allows additional configuration per group or resource. Next parameters are used:
- “User’s in group Capacity” or “Group Capacity”
- “without” or “within” In available slack
Be aware, that for the projects excluded from the prediction runs will be applied ‘Not Predicted‘ visual marker.
Prediction run can be executed repeatedly on new set of parameters, if required.
Prediction-Driven Delays
Prediction delay refers to the time difference between when a task is scheduled to start and when it is predicted to start. To visualize prediction delays, you have two options use ‘Prediction Dates’ or ‘Possible Dates’ setting.
The main difference between “Possible Date” Range and “Prediction Dates” lies in their purpose and flexibility. A “Possible Date” Range defines the earliest and latest possible time window for a task, considering constraints like dependencies and resource availability, offering flexibility within that range. On the other hand, “Prediction Dates” predict the actual start and finish dates for a task, based on current planning, task dependencies, and resource allocation. These dates are more specific and less flexible, as they are based on the assumption that everything will proceed according to plan. If delays occur, prediction dates can change, whereas the possible date range remains more general and adaptable.
With this information, you can compare the dates and take proactive steps to address potential issues, helping to prevent project delays.
Prediction Dates vs Possible Dates – Task List Group View
After running the prediction planning, you can use next fields on the Gantt chart for the analysis: “Prediction dates” from the “Prediction” plan Type and “Possible Dates” from the “Infinite capacity plan” Type.
To enable this functionality, please follow these steps:
- Navigate to the Pipeline page.
- Run the Prediction planning type.
- Navigate to the Group Task List.
- In the top right corner, click on the Gear Icon and enable
- “Prediction Dates”
- “Possible Dates”
With this information, you can compare the dates and take proactive steps to address potential issues, helping to prevent project delays.
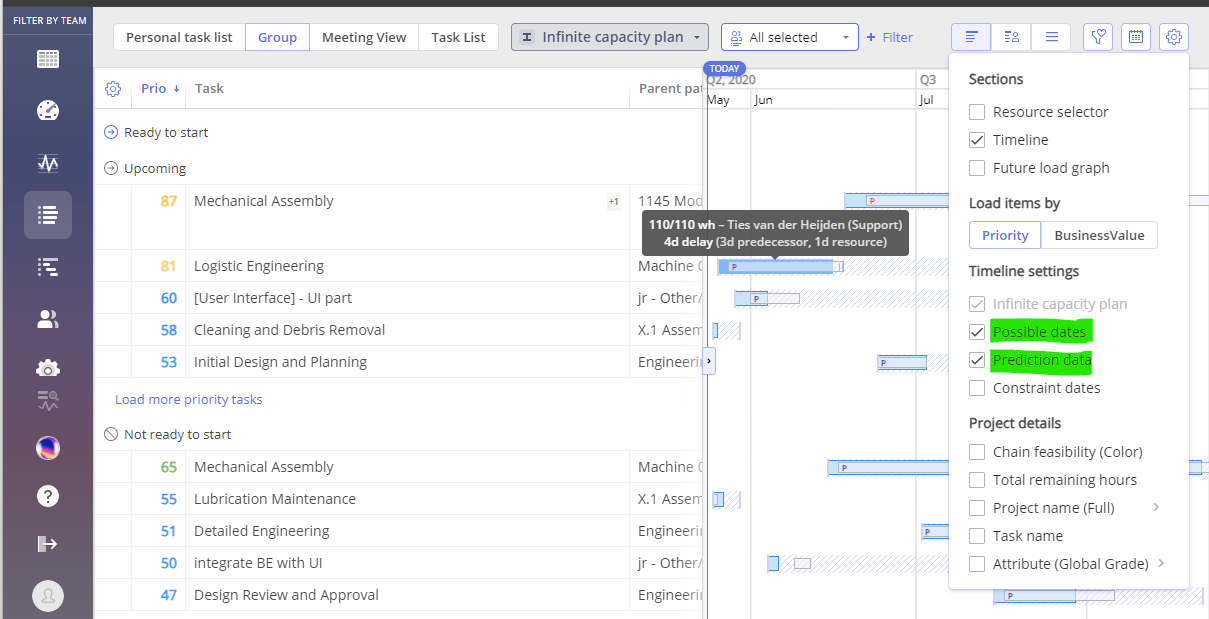
Screen #3 – Prediction-Driven Delays analysis
After enabling Prediction Data, you can see bars marked with the letter ‘P’ that represent the Prediction Data.
When the letter ‘P’ is marked in red, it means that the prediction date exceeds the possible date.
When the letter ‘P’ is marked in blue, it means that the prediction date doesn’t exceed the possible date.
Screen #4–Task Bar: Predecessor Delay and Resourcing Delay
Clicking on a task card provides additional details about the potential causes of predicted delays. To access this information, open the task card for the desired task and check the “Prediction” field.
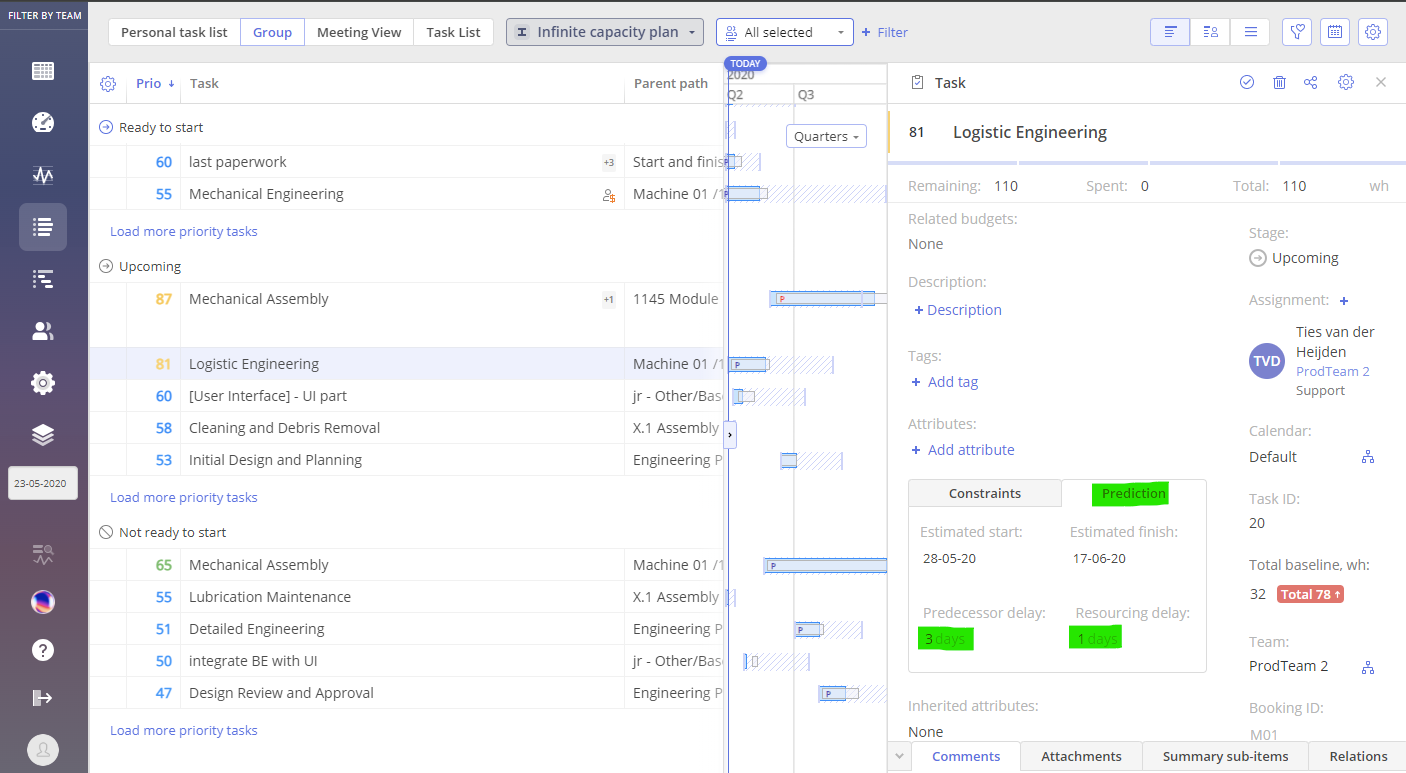
Screen #5 – Prediction-Driven Delays – Item Card
The “Predecessor Delay” field shows the predicted delay of the predecessor task and how many days this delay impacts the task you’re interested in.
The “Resourcing Delay” field provides information about delays caused by resource availability.
If a task bar extends beyond the possible dates range, it indicates a delay, prompting action.
In Epicflow, you have two options to visualize possible dates for the item execution.
Prediction Dates vs Possible Dates – Quick Edit Mode
In a similar way to Task List Group View you can compare same information and perform analysis from the Quick Edit Mode page. Follow next steps:
- Open Quick Edit Mode of a project
- In the top right corner, click on the Gear Icon
- Check the option for ‘Possible Dates’
- Choose the ‘Prediction (Single Project)’ option in the Plan Type selector drop-down.
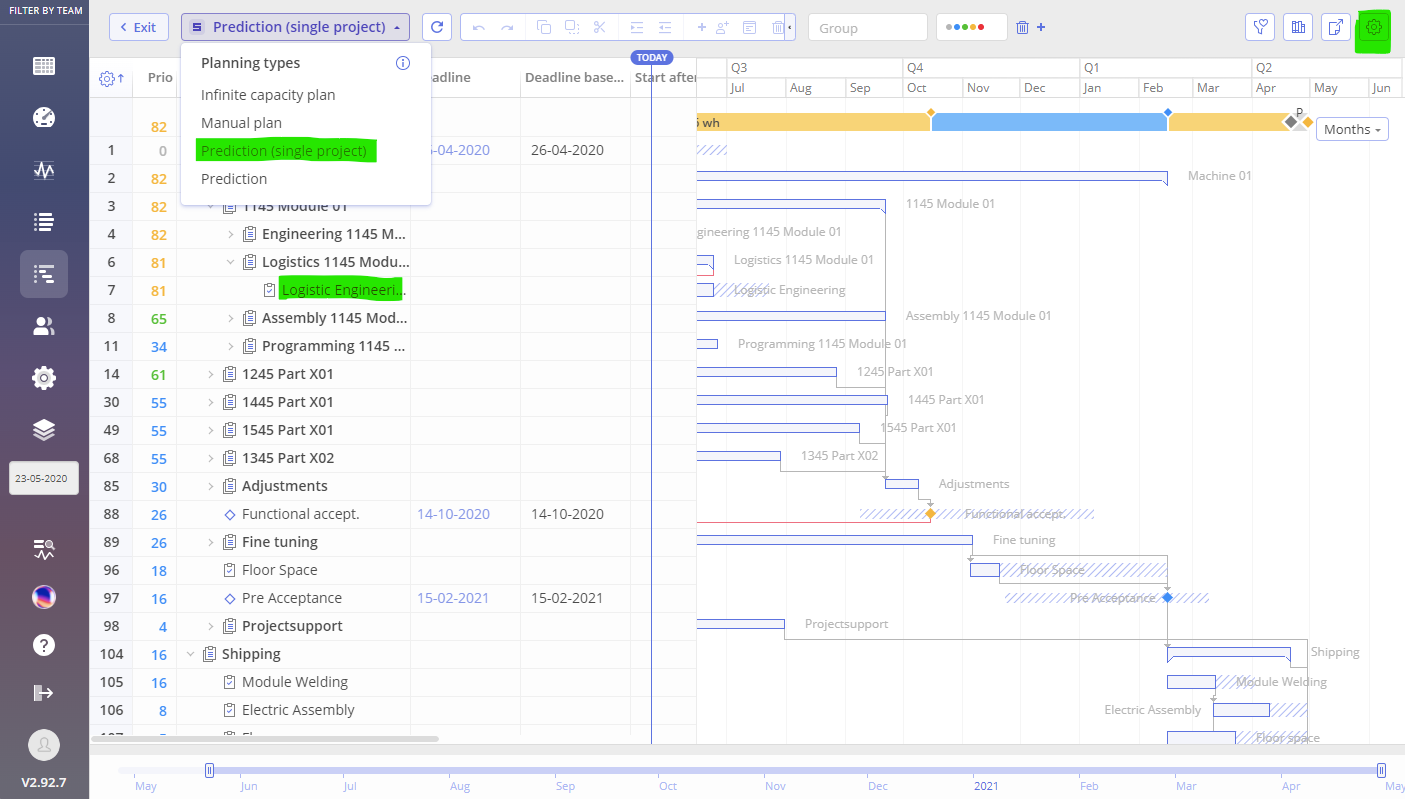 Screen #6 – Prediction-Driven Delays analysis – QEM
Prediction Delay – Example
In the example below, you can see that the ‘Logistic Engineering’ task isn’t delayed, as the prediction dates don’t extend beyond the possible date range. However, there is a Prediction Delay in the ‘Mechanical Assembly’ task, where the prediction data exceeds the possible date range.
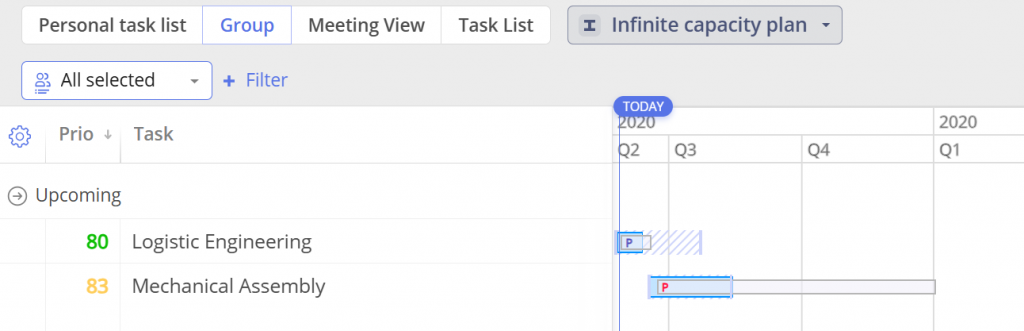
Screen #7 – Visualization of predicted delay
Permissions
To run Prediction users should be granted accordingly to the assigned roles with one or both permissions:
- Manage single project prediction
- Manage prediction
More about this you can read in this article.
Planning Type – Prediction (Advanced)
To proceed with Advanced Prediction configuration follow next steps
-
- Open Pipeline Prediction Frame
-
- In the top right corner, click over the “Advanced” toggle
- Adjust parameters as required
- Click over “Save and Run” to execute Prediction
Screen #8 – Advanced Prediction Setting
There several parameters that can be used for Advanced Prediction configuration:
-
- Prediction approach
-
- In available slack
Both of them can be configured per group or resource level.
Parameter – Prediction approach.
Defines Prediction based either on “User in Group Capacity” or on “Group Capacity”
“User in Group Capacity” method of Prediction, where the system attempts to assign specific user to task. In such approach pre-assigned users are always considered first for tasks accomplishment.
“Group capacity” method, in opposite to previously mentioned, ignores specific user assignment and only considers the overall group capacity for tasks accomplishment. Calculation of “Group Capacity” considers users working in multiple groups to avoid underutilization.
Parameter – In available slack
This parameter defines when the task will be taken into execution despite we do not have appropriate user/resource for that task accomplishment.
Value 100 means the task will be started just in time to be completed just before the milestone.
Value 80 – task will be started when priority for it is >= 80.
Possible usage scenarios
-
- to identify bottlenecks within a group
-
- to override “Group Capacity” for specific resources directly before Prediction run, instead of setting capacity at the resource level
-
- to simulate the impact of adding resources without necessity to modify Resource Pool as result of hiring new resources or performing additional training.
Attribute “High-importance” for tasks
Epicflow supports marking specific tasks as high importance for leveling.
When a task is marked as high importance:
-
It receives higher priority during leveling and prediction runs.
-
This elevated importance is applied regardless of other indicators, such as task priority, business value, or default scheduling rules.
-
The system will try to schedule and allocate resources to these tasks earlier compared to other tasks.
This feature is useful for:
-
Critical contractual obligations
-
Regulatory or compliance-related tasks
-
Time-sensitive activities that must be prioritized during prediction and leveling
Examples
This part of article will be filled in later, to address appearing questions.