Introduction
Epicflow offers several types of planning functionalities to help optimize project execution and resource management. Each method caters to different needs and project requirements, ensuring flexibility and precision in task allocation and scheduling.
Here’s a breakdown of the available planning types in Epicflow:
- Infinite Capacity Planning is the functionality that automatically calculates the best possible way of executing tasks taking into account their duration and relations.
- Manual Planning – provides a project manager with an opportunity to reposition items in the timeline as well as increase or reduce their duration manually for certain purposes. This functionality is created specifically for external communication. It has no effect on prioritization and load graphs.
- Single Project Leveling – identifies the sequence of accomplishing project tasks based on their priorities and/or business value and finite capacity for this project.
- Prediction – is used to set up the sequence of tasks when running multiple projects depending on their priority, business value, and finite capacity of all projects.

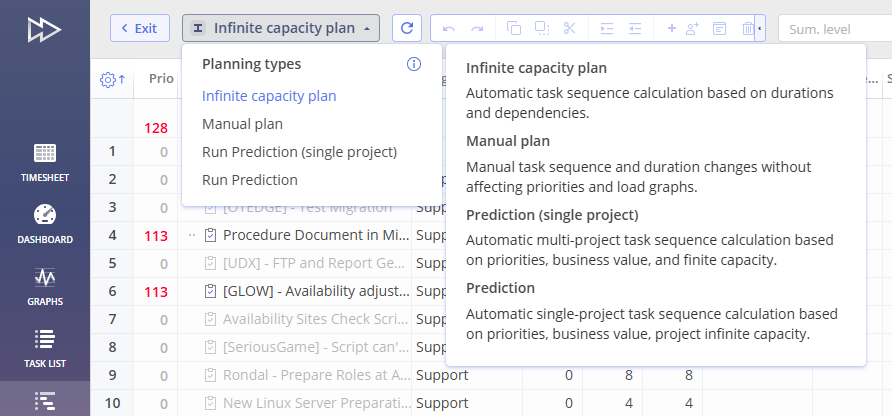
Screen #1 – Quick Edit Mode: Planning Types Selection
Infinite Capacity Planning
In this mode, Epicflow automatically plans the completion of all tasks as soon as possible based on their duration and relations between tasks and milestones in the project network. It assumes infinite resource capacity. With this planning type, the resource load graphs show you possible bottlenecks.
Prediction and Single Project Leveling
Prediction takes into account all projects and their interdependencies to create a sequence of task execution. This planning type considers the overall priorities and business value across all projects. This means that the system optimizes scheduling for the entire portfolio of projects, calculating task dates and generating a Gantt chart based on these priorities. It operates under a finite resource capacity, meaning the system ensures that resources are allocated within the available limits.
On the other hand, Single Project Leveling works in the same way as Prediction but is applied to individual, selected project and can only be executed within the Quick Edit Mode (QEM). This approach focuses on scheduling and adjusting tasks for a specific project, optimizing within its unique constraints. Unlike prediction, which applies to the entire pipeline, single project leveling is focused and tailored to the needs of a single project, balancing resources and task execution specifically for that project.
In summary, Prediction handles the bigger picture, considering all projects while Single Project Leveling is designed for more granular control of a specific project.
Screen #2 – 0% Capacity Notification
Using Planning Types in Epicflow
You can use planning types directly in the Pipeline View, Quick Edit Mode or the Task List Group View.

Screen #3 – Planning Types: Pipeline

Screen #4–Planning Types: Group Task List

Screen #5 – Planning Types: the Quick Edit Mode
Running Prediction for Projects
To run Prediction follow these steps:
- Navigate to the Pipeline Page.
- Select the ‘Prediction’ option from the plan selection drop-down.
- Adjust the parameter impact on the task order: Priority/Business Value.
- Click the ‘Run’ button.

Screen #6– Run Prediction
If projects are already predicted you can rerun Prediction by changing its value.
- Select the ‘Prediction’ option from the plan selection drop-down.
- Click the ‘Recalculate All’ Button.
- Adjust the parameter impact on the task order: Priority/Business Value.
- Click the ‘Run’ button.

Screen #7 – Re-run Prediction
If there are two projects, one active and one inactive, running a prediction in QE mode for the active project will generate a prediction distinct from that of the inactive project.
Single Project Leveling
Additionally, you can run a prediction planning type in Quick Edit mode for an individual project.
To run Leveling (Single Project)
- Navigate to the Pipeline Page.
- Access the QEM of certain project.
- Select the ”Leveling (Single Project )”option from the plan selection drop-down.
- Adjust the parameter impact on the task order: Priority/Business Value.
- Click the ‘Run’ button.

Screen #8– Run Single Project Leveling
Proactively Managing Project Delays
Prediction delay refers to the time difference between when a task is scheduled to start and when it is predicted to start. To visualize prediction delays, you have two options use ‘Prediction Dates’ or ‘Possible Dates’ functionality.
Prediction Data vs. Possible Dates
The main difference between Possible Date Range and Prediction Dates lies in their purpose and flexibility. A Possible Date Range defines the earliest and latest possible time window for a task, considering constraints like dependencies and resource availability, offering flexibility within that range. On the other hand, Prediction Dates predict the actual start and finish dates for a task, based on current planning, task dependencies, and resource allocation. These dates are more specific and less flexible, as they are based on the assumption that everything will proceed according to plan. If delays occur, prediction dates can change, whereas the possible date range remains more general and adaptable.
Prediction Data
There are two types of Prediction Data in Epicflow:
- Prediction Data – This option shows where the task would be positioned relative to the earliest start date, taking into account both predecessor delays and resource delays.
- Prediction Data (RTS) – In the Prediction view, this option displays the predicted ‘Ready-to-Start’ position of the task relative to the earliest start date, considering only predecessor delays and ignoring resource delays.
Infinite Capacity Plan and Prediction Data
By enabling the prediction data in the Group Task List, you can now view both the prediction dates and the infinite capacity plan dates on the Gantt chart. To enable this functionality, please follow these steps:
- Navigate to the Group Task List.
- Select Infinite capacity Plan
- Enable the Timeline by clicking the arrow in the middle of the right side of the screen.
- In the settings, enable the “Prediction Data” functionality.

Screen #9– Enable Prediction Data
With this information, you can compare the dates and take proactive steps to address potential issues, helping to prevent project delays.
After enabling Prediction Data, you can see bars marked with the letter ‘P’ that represent the Prediction Data.
When the letter ‘P’ is marked in red, it means that the prediction date exceeds the possible date.
When the letter ‘P’ is marked in blue, it means that the prediction date doesn’t exceed the possible date.
Prediction Plan and Prediction Data RTS (Ready To Start)
Switching to the Prediction Planning Type system will display only the prediction bars, which represent the projected timelines for tasks.
- Navigate to the Group Task List.
- Select Prediction Plan
If you want to see the prediction data showing where the task would be positioned relative to the earliest start date—taking into account only predecessor delays and ignoring resource delays. Please follow these steps:
- Navigate to the Group Task List.
- Select Prediction Plan
- Enable the Timeline by clicking the arrow in the middle of the right side of the screen.
- In the settings, enable the “Prediction Data (RTS)” functionality.

Screen #10– Enable Prediction Data (RTS)
Predecessor Delay and Resourcing Delay
- The “Predecessor Delay” shows the predicted delay of the predecessor task and how many days this delay impacts the task you’re interested in.
- The “Resourcing Delay” provides information about delays caused by resource availability.
You can view both of these information in two ways: by hovering over the task bar on the Gantt chart or by accessing the task card.
Task Card and Prediction Data
Clicking on a task card provides additional details about the potential causes of predicted delays. To access this information, open the task card for the desired task and check the “Prediction” field.

Screen #11a–Task Card: Predecessor Delay and Resourcing Delay
Gantt Chart and Prediction Data
- Make sure Prediction Data is enabled (see instructions above).
- Enable the timeline.
- Hover over the task bar to display additional information.

Screen #11b–Task Bar: Predecessor Delay and Resourcing Delay
Prediction Data Delay Example
In the example below, you can see that the ‘Logistic Engineering’ task isn’t delayed, as the prediction dates don’t extend beyond the possible date range. However, there is a Prediction Delay in the ‘Mechanical Assembly’ task, where the prediction data exceeds the possible date range.

Screen #12– Prediction Data Delay Example
Possible Dates
If a task bar extends beyond the possible dates range, it indicates a delay, prompting action.
In Epicflow, you have two options to visualize possible dates for the item execution.
- in Quick Edit Mode
- in Task List Group View
Visualize possible Dates in Quick Edit Mode
- Open Quick Edit Mode of a project
- In the top right corner, click on the Gear Icon
- Check the option for ‘Possible Dates’

Screen #13– Enable Possible Dates in the Quick Edit Mode
Visualize possible Dates in Task List Group View
- Navigate to Task List Group View
- Enable the Timeline to view possible dates for task execution.
- In the top right corner, click on the Gear Icon
- Check the option for ‘Possible Dates’

Screen #14– Enable Possible Dates in the Group Task List
Possible Dates Delay Example:
In the image below, you can observe that the CR Introduction Task is not predicted to be delayed, as the possible dates bar does not precede the task execution. However, the AB Introduction’s possible dates bar precedes the task execution, indicating a predicted delay that requires prompt action.
Screen #13 – Visualization of predicted delay
Manual Planning
As has been noted above, in the Manual Planning mode, you as a project manager can reposition project items in the timeline, expand or decrease their duration manually for special needs. For instance, a project manager can change the project duration before the meeting with clients to hide the float (buffer) from them as they may consider it as unnecessary idle time. Besides, a PM can apply manual planning just to compare their own approach to the execution of the project and the way the Epicflow system suggests to run it.
Epicflow algorithms provide the best possible way to complete your multiple projects on time, so the Manual Planning functionality is just a way of communicating with clients. It has no effect on prioritization and load graphs.
Let’s consider the ways you can plan your project flow manually.
Repositioning Items
To plan the order of completing project tasks and summaries, a Project Manager (PM) can use an item re-positioning option provided by the “Manual Plan” mode by drag-and-drop directly from the Gantt chart.

Screen #14– Planning Mode – Task Repositioning

Screen #15 – Planning Mode – Summary Repositioning
Remember that any Summary or Task position changes will affect all the chain of successors but won’t change predecessors.
If a Summary contains a milestone, the repositioning will limit one of the Summary boundaries.

Screen #16 – Planning Mode – Repositioning Summary with a Milestone
For all actions like this, the order of Summary sub-items remains unchanged.
To reset the item’s position to the initial one select the “Reset to Auto Plan” option in the context menu.

Screen #17 – Planning Mode – Position Reset
Please note that the position reset will be applied only for the selected item.
Changing Duration
Task duration is one of the main parameters in project planning. It can be changed only in the “Manual plan” mode view.
You can extend or decrease task duration by using a special separator located to the right of the task at a Gantt chart. Please, note that this element appears only for tasks. The Summary duration can be adjusted only by changing its sub-items’ positions.

Screen #18 – Planning Mode – Task Duration

Screen #19 – Planning Mode – Changing Summary Duration
Keep in mind that initial estimations won’t be changed as a result of this action.